We are dominated by information overload, and data has become the new currency. However, analyzing raw data in conventional ways is often complex, prone to errors, and time-consuming. This is where data visualization steps in.
Data visualization involves taking complex datasets and transforming them into easily understandable graphics, charts, and maps. This simplifies complex trends and reveals data patterns and anomalies that might otherwise be hidden.
_1723102635.jpeg)
The Power of Storytelling with Data
The human brain is wired for visuals. We process images 60k times faster than text. This is why data visualization is such a powerful tool. It's not just about presenting data; it’s about telling a story for your business with it.
Consider a simple line chart. It can tell a powerful story about growth, decline, or stability over time. A bar chart can compare different categories at a glance. A scatter plot can reveal hidden correlations between variables. Each visualization is a chapter in the larger story of your data.
The Visualization Revolution
Data visualization is no longer a niche skill. It's a core competency for businesses across industries. From finance to healthcare, from marketing to engineering, organizations are harnessing the power of visuals to gain a competitive edge.
The adoption of data visualization is a global trend. Countries like the United States, the United Kingdom, and Australia have been early pioneers. However, the practice is rapidly spreading worldwide.
Nations in Asia, particularly India and China, are experiencing a surge in data visualization adoption. The region's growing tech industry and increasing focus on data-driven governance are driving this trend. Even Scandinavian countries, renowned for their data-driven cultures, are at the forefront of data visualization innovation.
The Rise of Big Data and the Need for Clarity
Data is being produced at an exponential rate, from social media interactions to IoT sensor readings. This data deluge presents both opportunities and challenges. Organizations are grappling with harnessing this wealth of information to gain a competitive advantage.
Data visualization has now emerged as a powerful tool to navigate this complexity. By transforming raw data into visual represented facts, businesses can uncover hidden patterns, identify trends, and confidently make data-driven decisions.
Technological Catalysts
Advancements in technology have been instrumental in expediting the need for data visualization forward.
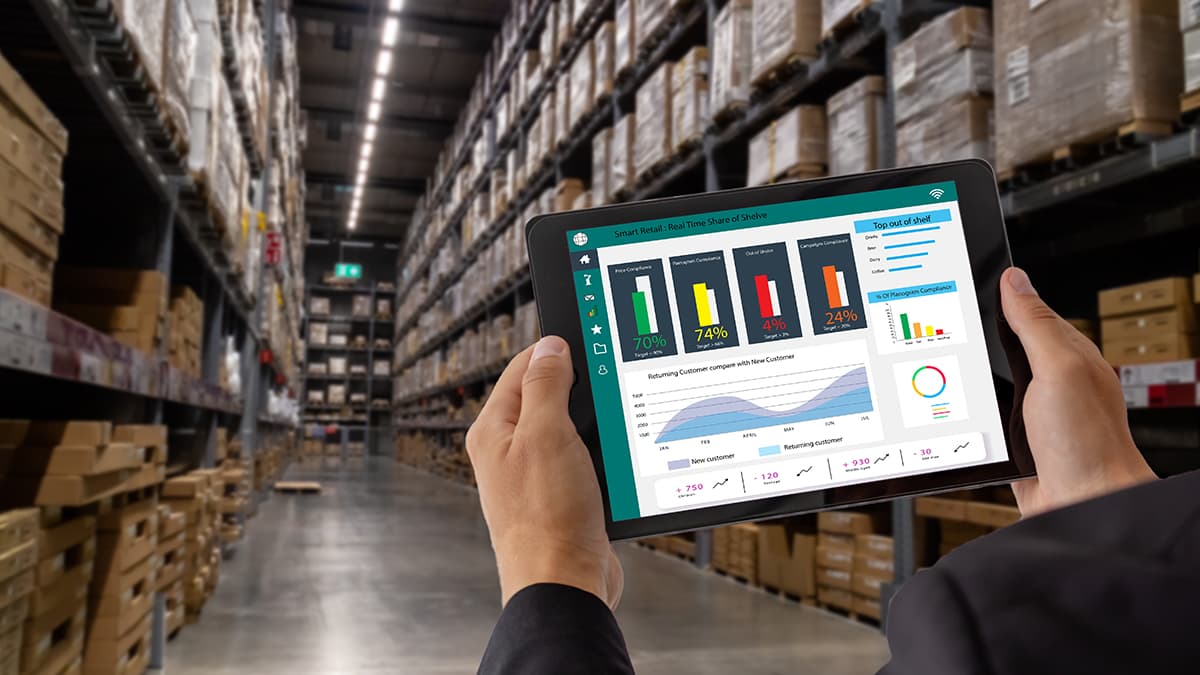
• Interactive Dashboards: These dynamic tools allow users to explore data interactively, uncovering insights that static reports cannot. For example, a financial institution can build a dashboard that displays real-time market data, allowing analysts to identify trading opportunities rapidly.
• Augmented and Virtual Reality: Immersive visualization experiences are redefining how we interact with data. Imagine exploring sales data in a virtual environment or visualizing complex medical data in 3D.
• Artificial Intelligence: AI-powered tools are enhancing data visualization by automating tasks, including data cleaning, feature selection, and chart recommendation. This frees up analysts to focus on higher-level insights.
A Culture Shift: Data-Driven Decision Making
The increasing emphasis on data-driven decision-making has created a fertile ground for data visualization to thrive. Businesses are recognizing that informed decisions lead to improved outcomes.
• Predictive Analytics: By visualizing historical data and identifying patterns, organizations can predict future trends. A retail company might use visualization to forecast product demand based on past sales data.
• Risk Management: Financial institutions employ data visualization to assess risk profiles, identify potential threats, and develop mitigation strategies.
• Marketing Optimization: Marketers use visualizations to analyze customer behavior, measure campaign effectiveness, and optimize marketing spend.
The Human Factor: Data Literacy
A parallel shift in data literacy has also contributed to the visualization revolution. As more people become comfortable with data, the demand for effective visual communication has grown.
• Citizen Data Scientists: With user-friendly tools, many employees are becoming data-savvy, creating a need for clear and compelling visualizations.
• Storytelling with Data: Effective data visualization is about more than creating pretty pictures. It is about creating a narrative that aligns with the audience's interests.
The convergence of big data, advanced technology, a data-driven culture, and increasing data literacy has propelled data visualization into the mainstream. As organizations of all sizes continue to cope with the complexities of the digital age, the ability to turn data into actionable insights through visualization will become a critical differentiator.
CSM Tech: Your Data Visualization Partner
_(1)_1723102591.jpeg)
CSM Tech, a veteran in the IT industry with over 26 years of experience, is a leading provider of data and analytics solutions. We help organizations of all scales transform raw data into actionable insights for making data-driven decisions.
Our team of experts is skilled in a variety of data visualization tools, let’s uncover one by one:
1. Tableau
Tableau is a leader in transforming complex data into intuitive, interactive visualizations. Its drag-and-drop interface enables users of all skill levels to explore data easily. Tableau's flexibility stands out in creating dynamic dashboards that can be filtered, sorted, and drilled down, providing unparalleled insights. From simple charts to sophisticated geographic maps, Tableau offers a vast array of visualization options, making it a critical tool for data-driven decision-making.
Leveraging Tableau's potential requires skilled implementation and ongoing support. CSM Tech offers comprehensive Tableau implementation services, from data integration and design to deployment and training. Our team of certified Tableau professionals brings deep expertise to every project, ensuring optimal platform utilization. With a focus on understanding client-specific needs, we deliver tailored Tableau solutions that drive business value. CSM Tech's commitment to staying updated with the latest Tableau features and best practices guarantees that our clients benefit from the most advanced capabilities.
2. SAS
SAS offers a robust analytics tool suite that extends far beyond basic data visualization. Its capabilities encompass advanced statistical modeling, machine learning, and predictive analytics, all of which can be seamlessly integrated into compelling visual representations. This holistic approach enables organizations to uncover deeper insights and make more informed decisions. From exploratory data analysis to production-grade analytics, SAS provides a comprehensive platform for data-driven success.
With a deep understanding of SAS's capabilities, CSM Tech delivers tailored solutions that leverage the platform's full potential. Our expert team of SAS developers has the experience and expertise to address complex business challenges through advanced analytics and visualization. We offer a range of services, including data preparation, statistical modeling, and custom visualization development. By partnering with CSM Tech, organizations can harness the power of SAS to drive innovation and achieve their business objectives.
3. Microsoft Power BI
Power BI excels as a user-friendly business intelligence tool, offering a seamless path to data exploration and visualization. Its intuitive interface empowers users to create interactive reports and dashboards with minimal technical expertise. Power BI's strong integration with the Microsoft ecosystem makes it a natural choice for organizations already invested in the Microsoft suite.
Our team at CSM Tech is proficient in harnessing Power BI's capabilities to deliver impactful data solutions. We specialize in designing and implementing visually appealing and informative dashboards that align with business objectives. Our expertise extends to data modeling, DAX calculations, and report optimization. By leveraging Power BI's potential, we help organizations unlock insights and make data-driven decisions.
4. IBM Watson
IBM Watson brings the power of artificial intelligence to data visualization, enabling organizations to uncover hidden patterns and predict future trends. By combining advanced analytics with compelling visuals, Watson transforms data into actionable insights. From predictive modeling to natural language processing, Watson's capabilities elevate data visualization to new heights.
As an IBM official partner, CSM Tech leverages this cutting-edge technology to deliver innovative data solutions. Our team possesses deep expertise in applying Watson's capabilities to real-world business challenges. By combining Watson's AI prowess with our data visualization expertise, we help clients uncover hidden opportunities, optimize business processes, and make data-driven decisions.
The Art and Science of Visualization
Effective data visualization is a blend of art and science. It requires a deep understanding of data, a strong design sense, and a knack for storytelling.
_1723102501.jpeg)
Data Preparation
Clean, accurate, and relevant data is the bedrock of effective data visualization. Data preparation involves a series of steps, including data cleaning, transformation, and integration. CSM Tech's expertise in data preparation ensures that our visualizations are built on a solid foundation.
Choosing the Right Chart Type
Selecting the appropriate chart type is crucial for conveying information effectively. A bar chart is ideal for comparisons, while a line chart excels at showing trends over time. Other common chart types include scatter plots, histograms, and heat maps. CSM Tech's data visualization experts have a deep understanding of different chart types and their applications.
The Power of Color
Color is an important aspect of data visualization. It can enhance understanding, guide attention, and evoke critical thinking. A well-chosen color palette can make a visualization more engaging and informative. CSM Tech's design team incorporates color psychology to create visually appealing and effective visualizations.
Interactive Elements
Interactive elements can transform static visualizations into dynamic tools for exploration. Features like zooming, filtering, and drilling down allow users to uncover insights quickly. CSM Tech incorporates interactive elements into our visualizations to provide a richer user experience.
Data Storytelling
The most effective visualizations tell a story. By structuring data points into a coherent narrative, you can guide the viewer's attention and make your message more impactful. CSM Tech's data storytelling approach helps clients communicate their data effectively and achieve their desired outcomes.
The Future of Data Visualization
The future of data visualization is a dynamic landscape brimming with potential. With evolving technologies, we anticipate a future where data is seamlessly integrated into our world through immersive experiences. Augmented reality and virtual reality will transform data consumption, allowing users to explore complex datasets in three-dimensional spaces. Artificial intelligence will become an indispensable partner, automating routine tasks and uncovering hidden insights that would otherwise remain obscured.
CSM Tech envisions a future where data visualization is not merely a tool, but a strategic advantage. We are committed to being at the forefront of this evolution, investing in research and development to explore the possibilities of emerging technologies. Our goal is to empower organizations to harness the full potential of their data through innovative visualization solutions. By combining human ingenuity with cutting-edge technology, CSM Tech is poised to redefine the future of data storytelling.
As a leading data visualization services provider, CSM Tech is dedicated to discovering all possibilities. Our data visualization experts are passionate about exploring new frontiers in data visualization and collaborating with clients to bring their data stories to life in innovative ways. We believe that the future of data visualization is not just about technology but also about human-centered design and storytelling. By combining these elements, we create experiences that inspire, inform, and drive action.
Ready to unlock the power of your data? Contact CSM Tech today to discuss your data visualization needs and learn how we can help you turn data into actionable insights.
Want to start a project?
Get your Free ConsultationOur Recent Blog Posts

© 2025 CSM Tech Americas All Rights Reserved


